
Things You Should Know Before Visiting Paris

Paris, with more than 2000 years of history1, will host the 2024 Olympic Games in particular and, although it was the scene of a recent world drama with the Notre-Dame fire, remains one if not the most visited city in the world (and I am not saying that because I am french!)23.
If you are dying to visit the Eiffel Tower, stroll through the artistic districts of Montmartre or even sail on a barge on the Seine, here is some information that might be useful to you.
To come and visit Paris you can look for accommodation, a hotel by your own means. Otherwise in recent years, an online service has developed considerably: Airbnb.

If you have followed technological news recently you have necessarily heard about the resounding successes such as:
- those of DeepMind with AlphaZero, an AI that masters chess, shogi, and Go games through self-play45
- or Pluribus an AI bot that masters Texas hold’em poker with 6 players6!
The advances of AI are numerous and affect many fields (commerce, finance, medicine, etc.).
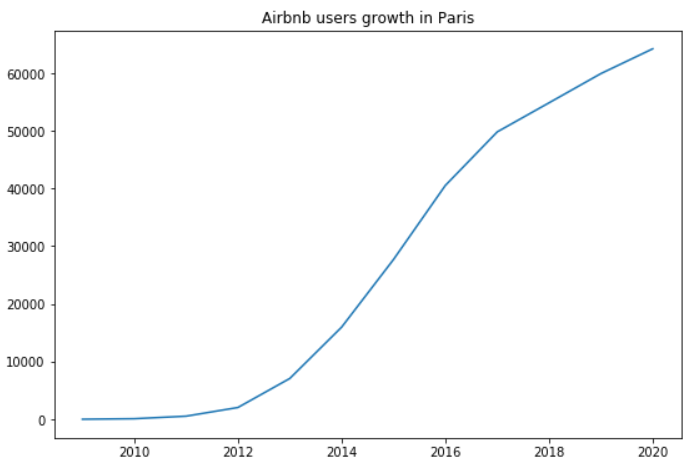
Machine learning and Artificial Intelligence are no longer a fashion trend but a real subject that has developed quickly in recent years:

Well, Airbnb is a company very present and active in the machine learning sector. It does not hesitate to share some of its data, publish tools it has developed in open source such as Airflow7 and regularly publish posts on its technical blog8 to share its thoughts and research areas.
In this post I propose you to explore AirBnb’s data relating to the city of Paris and thus discover what we can extract from it and to what extent we can train algorithms to learn from these data.
NOTE: Everything that follows is based on personal work done as part of one project done during my self-training via Udacity DataScience nanodegree.
The comments, interpretations and conclusions are therefore my own ones and are my sole responsibility. This work should therefore not be considered for anything other than their learning value.
ACKNOWLEDGEMENT: data come from airbnbinside and can be collected from here. I took the one from July 2019 so everything that comes next is time-based on this period.
Let’s get this party started!
The remainder of this post is organized into two topics:
- The first one is related to data analysis and will aim to answer questions from this scenario:
Let’s put myself in the shoes of a tourist who would love to come and visit Paris. As a tourist/foreigner, an Airbnb service user and also someone who absolutely does not know Paris, I would like to know what is the best period or the best place (or both) in order to plan my visit/holidays. As “best” can means a lot, here:
- I would like to have a pretty good idea of the cost variation depending on location place
- Same for visiting period
- I would be glad to know what are the odds to find something available for a given period so that perhaps I can adapt my holidays accordingly to places availabilities (there is an alternative for the homeowner who would like be sure to rent at the best time that will maximize the profit and so maybe adapt the location availability depending on the market as well).
- The second one is more related to machine learning algorithms:
Let’s see if we are able to predict price with pretty good accuracy/confidence for a given listing? Indeed, as a service user who plans to rent its home, I can spend plenty of time by looking at other places and their price to find the best but still competitive price to ensure I will be chosen. Or, more user friendly: based on information I give, the system predicts the right price!
1. At the right place…
In data, Airbnb listings are provided with latitude and longitude coordinates. When we plot them on a scatterplot, here is what we get:
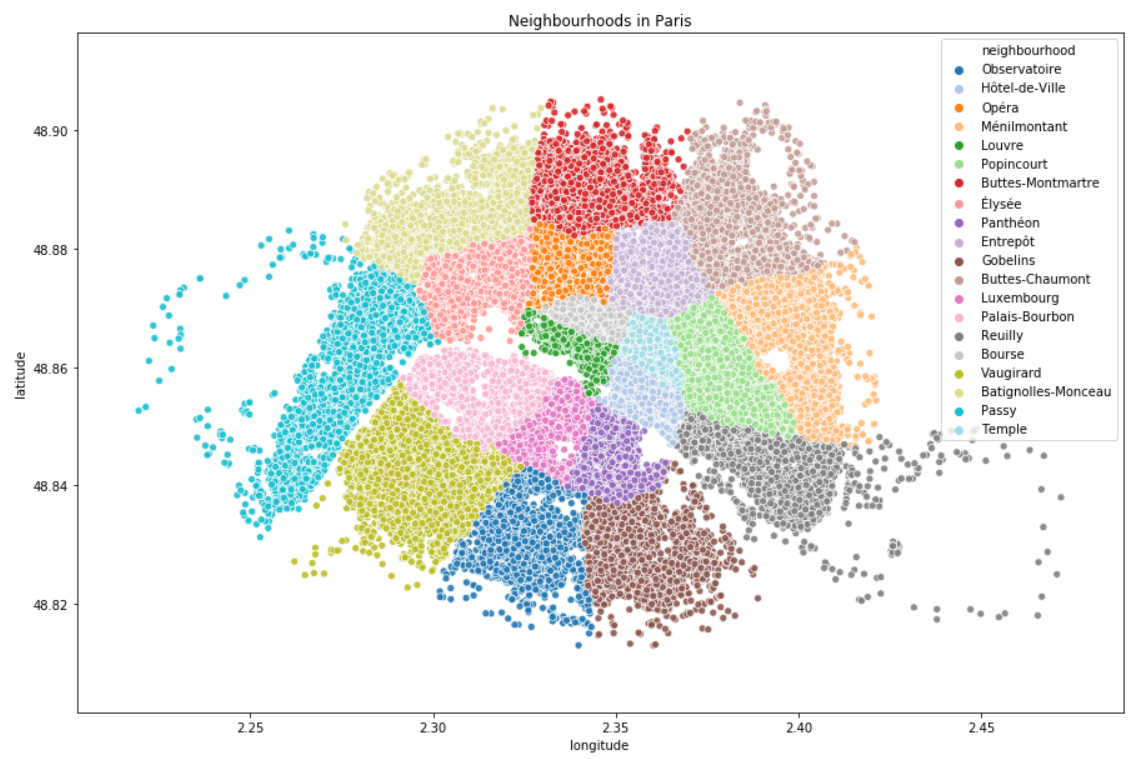
NOTE: we can clearly see that there are no listing in some places in neighbourhoods 12 or 16 (respectively Reuilly and Passy), it is because there are some woods (Vincennes, Boulogne). We are also able to guess the Seine which is the river that crosses the city.
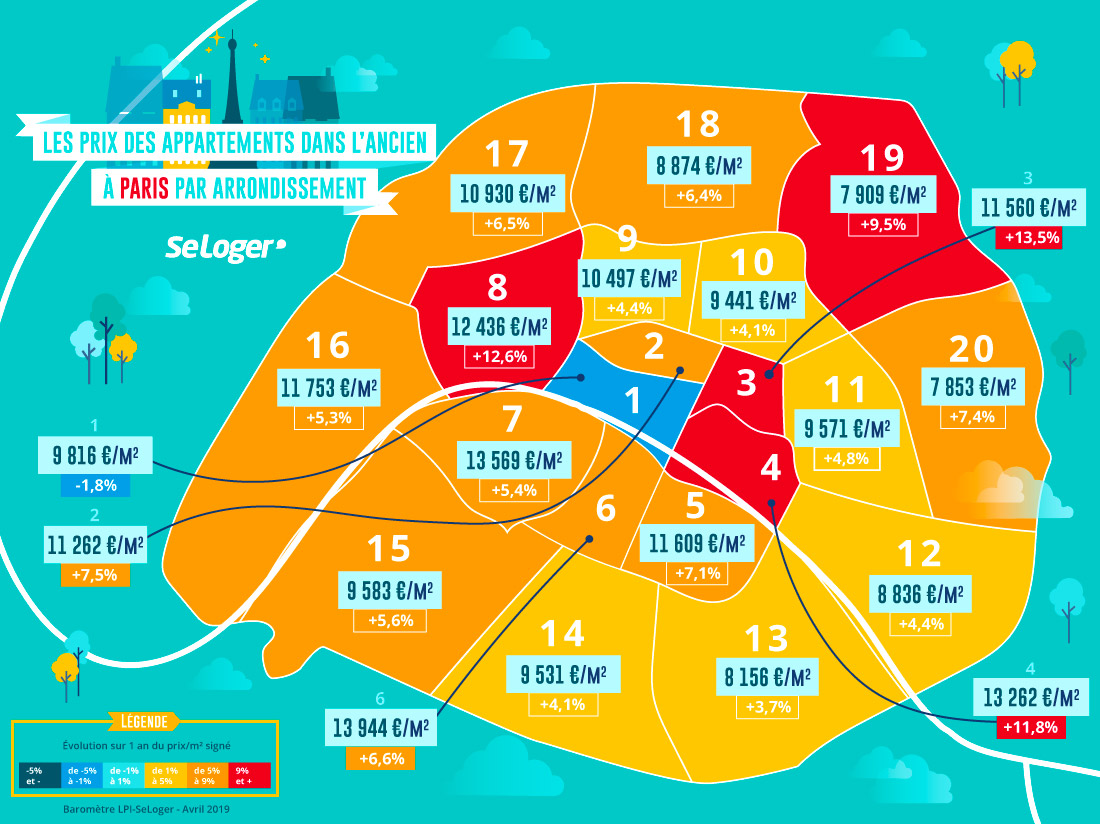
It is written in this french study published in April 20199 that “the price of real estate has reached stratospheric levels and totally disconnected from residents’ incomes. But what are the prices, neighbourhood per neighbourhood?”
According to this study, top 5 is:
– 6e (Luxembourg) (13 944 €/m2)
– 7e (Palais-Bourbon) (13 569 €/m2)
– 4e (Hotel-de-Ville) (13 262 €/m2)
– 8e (Elysee) (12 436 €/m2)
– 16e (Passy) (11 753 €/m2)
Whereas 19e and 20e (respectively Buttes-Chaumont and Menilmontant) have the “cheapest” price.
So, has the neighbourhood a real impact on the price?
Is it something that we can also observe in our data? Can we confirm the french study observations?
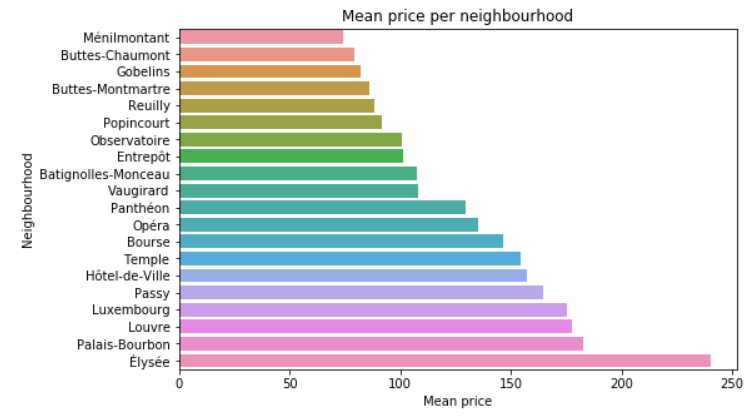
Interesting: the top 5 from the study is within the top 6 of the mean price! Here are some other insights caught from data:
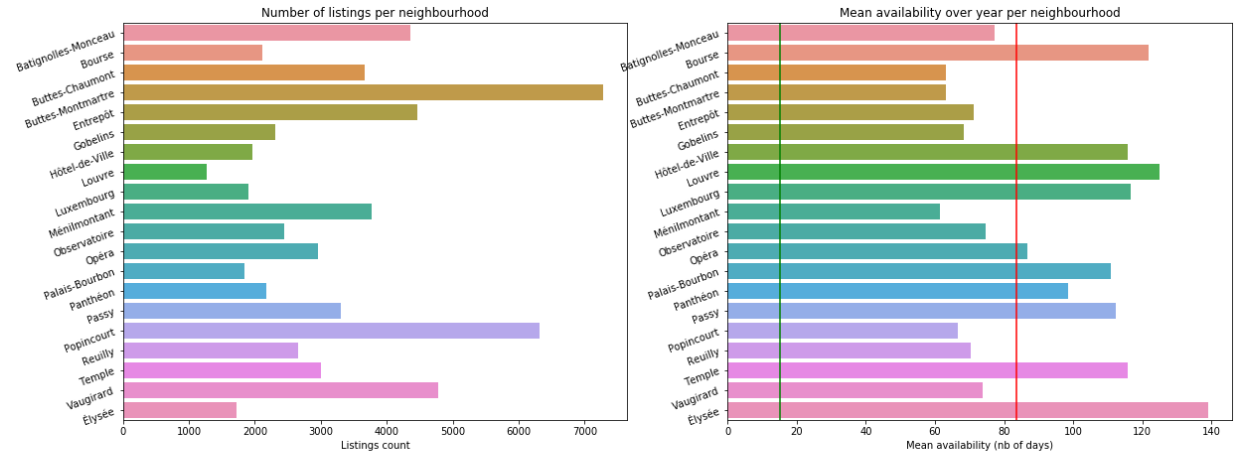
Elysee is far the most expensive neighbourhood and the one with most availability (perhaps due to the price?) even if there are few listings (only Louvre has less listings to offer).
10 neighbourhoods have mean price above the mean value (116€) while 10 have mean price below. So it’s a 50-50.
It is though important to notice that only 2 neighbourhoods have mean price below the median value (80€): Menilmontant and Buttes-Chaumont. Same result than the study! In those 2 neighbourhoods, there are a lot of listings but with few availability per year, 60 days in average.
But of course it depends on type of room I will rent, right?
In Airbnb data, there are 3 types of room available to rent:
- Entire home/apt
- Private room
- Shared room
What is their share? Where are they? Does it really change something on the price?
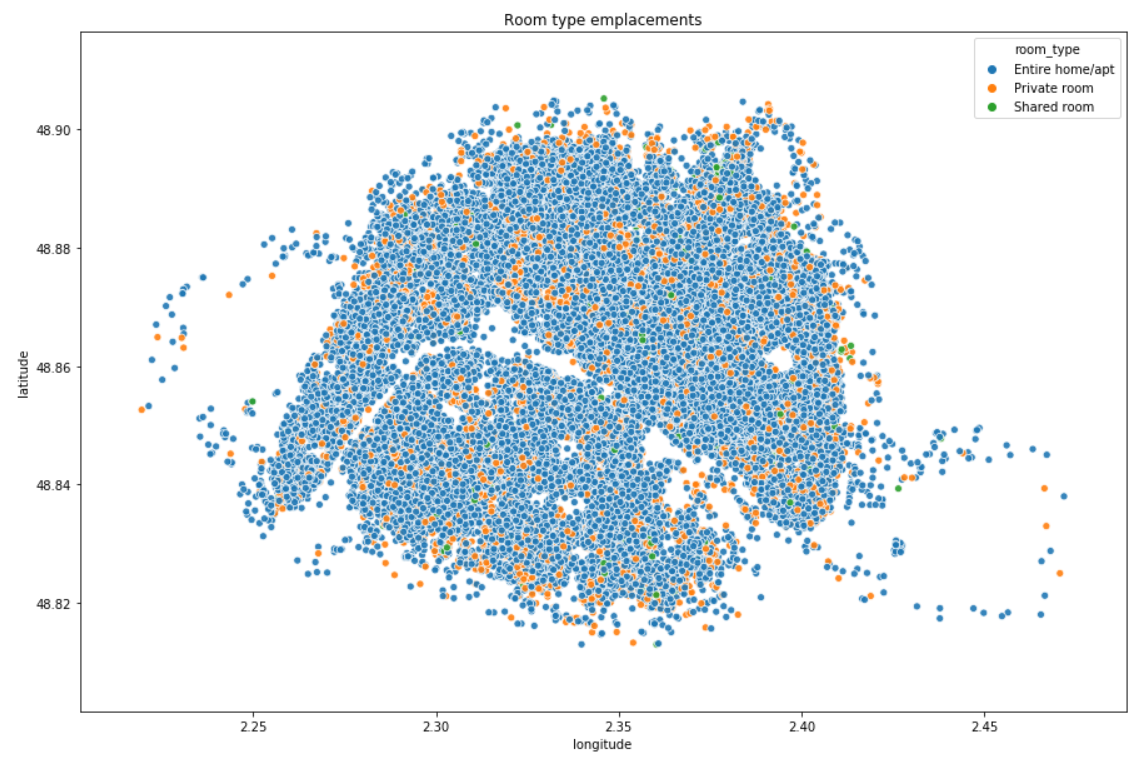
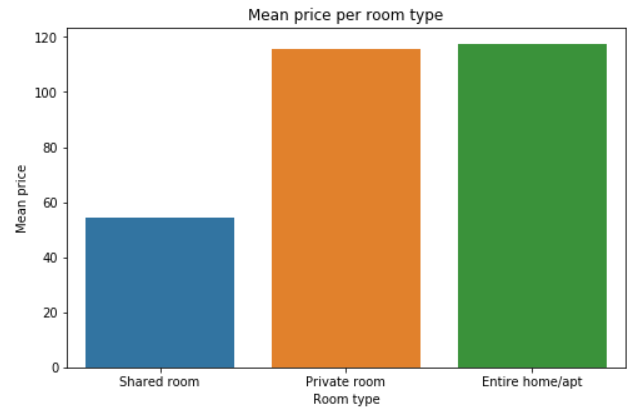
86% of the listings are ‘Entire home/apt’ whereas there are less than 1% of ‘Shared room’.
This is interesting: choosing a private room or an entire apartment has few influence on the price. On the other side, you can expect to divide by 2 the mean price by choosing a shared room. There are less than 500 shared rooms available but they are almost everywhere.
Where are the most and less expensive listings?
We have seen that shared rooms are less expensive so in this section they are filtered to not catch them in the less expensive listings.
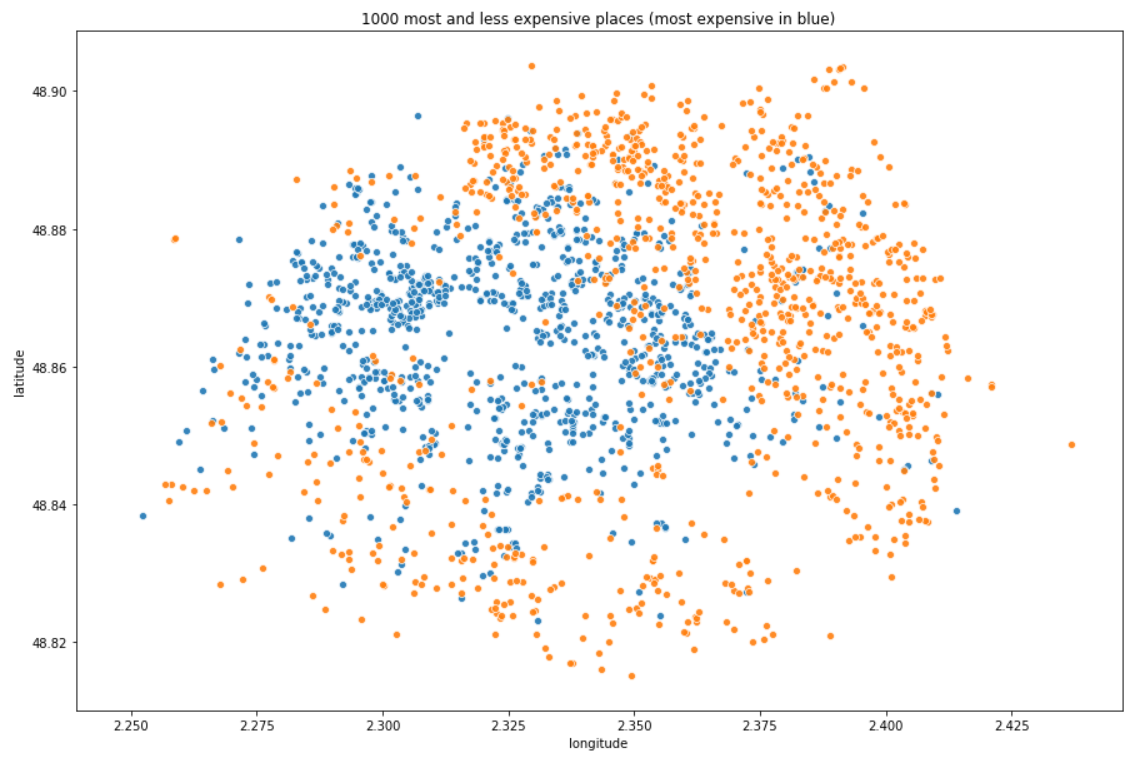
OBSERVATIONS: depending on your budget, it can really cost you a lot to sleep in Paris. The most expensive neighbourhoods are the one in the center of the city, you will pay less and less gradually as you go further but in those neighbourhoods, the availability rate is not very high because you will probably find apartments in which people live most of the time and rent when they are away from their home.
Tip: you can expect to divide by 2 the mean price by choosing a shared room and there are almost everywhere in the city so that you are not stucked in a specific place. So, ready to share your room?
2. …and at the right time!
Choosing the right period
Are there some periods of time with higher/lower availabilty?
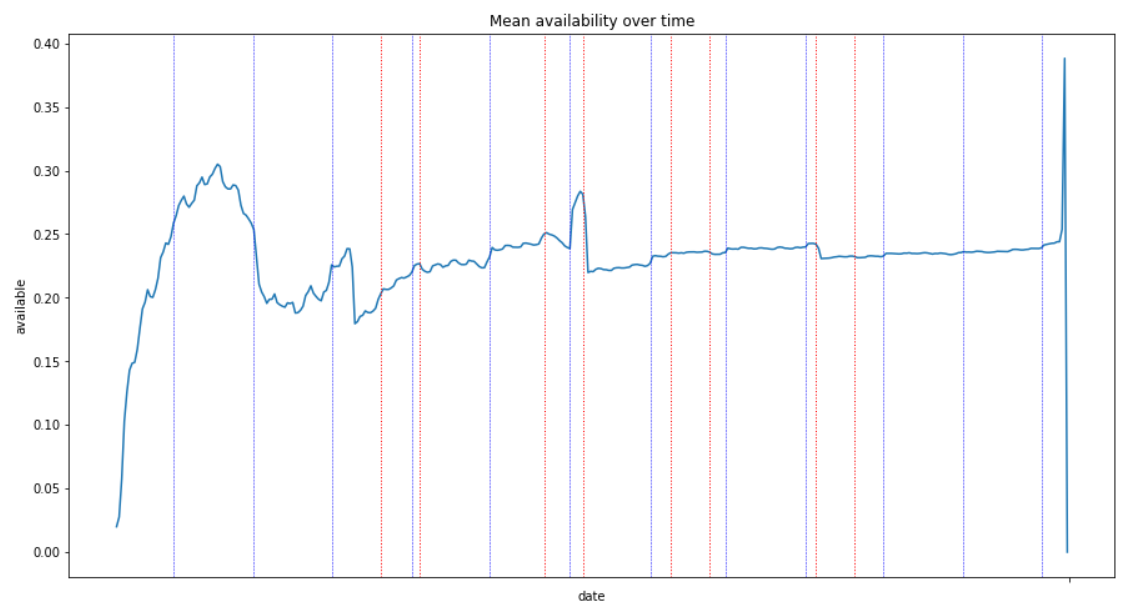
Note: vertical dashed red lines corresponds to french school holidays begin/end dates. I wanted to see whether availability was impacted or not. The blue ones are just here to show the end of each month.
OBSERVATIONS:
- availability is very low at the beginning (July) but I guess this behaviour is expected as most of the listings have found guests for the next coming weeks (remember that the data are the one from July).
- there is a peak in August which is the highest availability. Again, this is summer holidays and I guess that a lot of people are leaving and then put their home/apartment as available.
- we then see the 'Back to school' impact in September with another availability during autumn holidays.
- it then becomes more and more available with a new availability peak just after Christmas holidays, for New Year (want to see fireworks at Eiffel Tower?).
- after that it goes back to "normal" and flat rate perhaps because it is so far that people just left their calendar as it has been filled without changing anything.
Note: it seems that school holidays have not really a big impact.
Variation of price over time
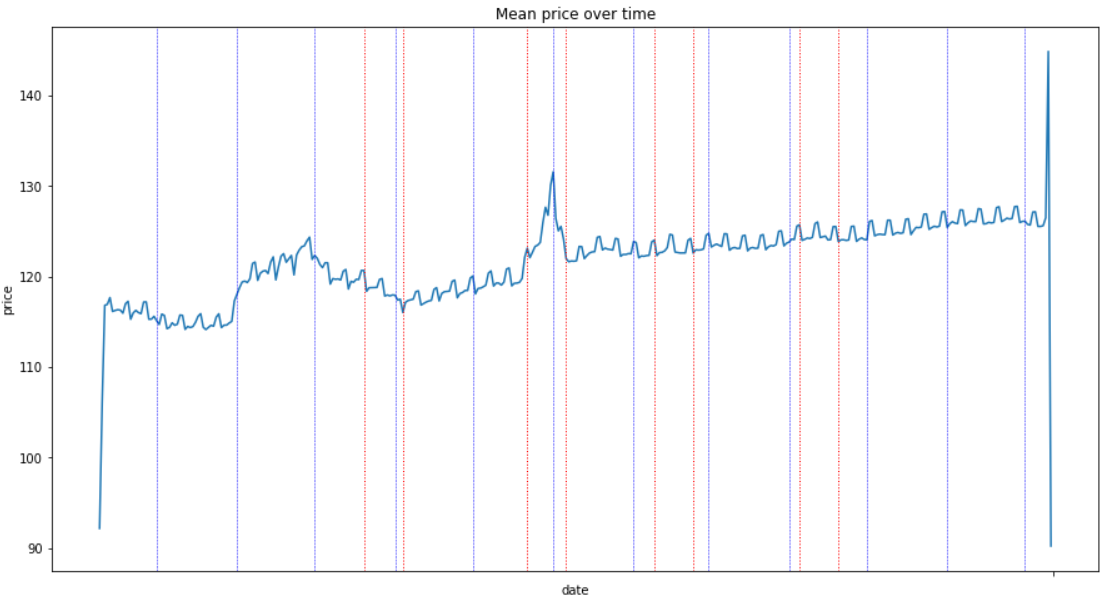
OBSERVATIONS:
It is typically the law of supply and demand:
- prices are lower in August (because there are a lot of rooms to share and home owners prefer offering discount than keeping the apartment and in the end earn nothing).
- there is a peak during Christmas holidays so even if there are more apartments available, you will spend more money if you plan coming for New Year fireworks at Eiffel Tower.
- the "small" and recurrent peaks corresponds to weekends. Prices are higher during the weekends. There are no small savings.
Is there a big difference between neighbourhoods?
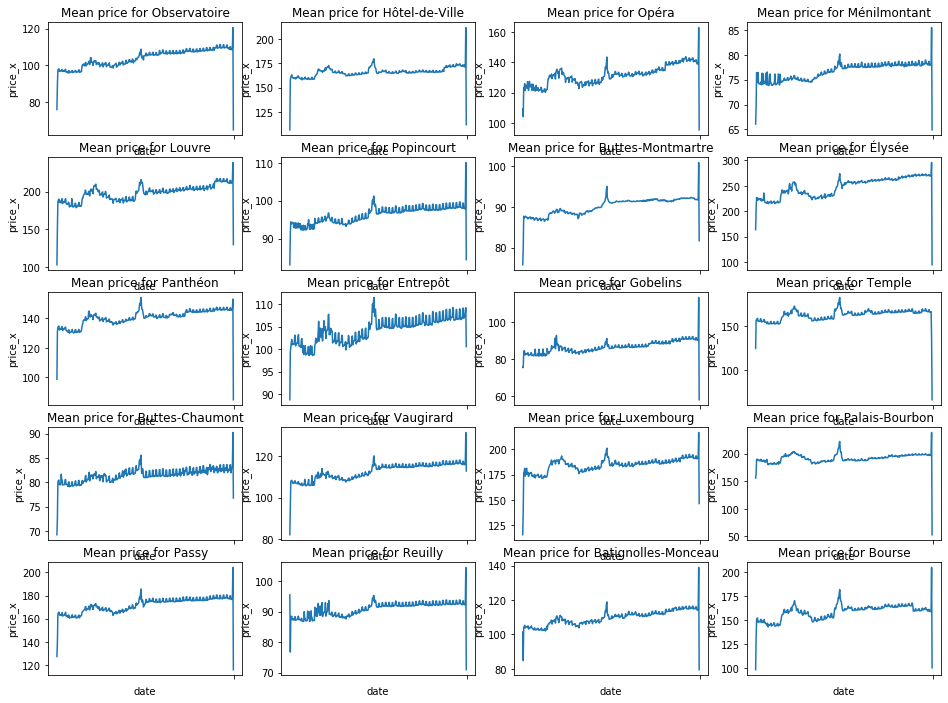
There are real differences depending on the neighbourhood: Entrepôt has high variations whereas Hôtel-de-Ville is more or less at the same price over the year.
No matter the neighbourhood, they all contain, at different level of price, the same peak in january for New Year.

OBSERVATIONS:
If we do not take into account the period after Christmas (because prices are increasing with lower availability, I guess people mostly gave availabilities for 2019 but dit not yet do the same thing for 2020), we can see that:
- the 'Christmas effect' results in +6% (average) for prices with some neighbourhoods above that (Elysee has +10% for example, where you can find the Champs Elysees).
- the 'New Year effect' has a huge impact on neighbourhoods in the center such as Elysee, Palais-Bourbon, or Temple with +17 to +19%!
And now it’s time to try to predict the price!

What kind of problem is it and how can we evaluate our performance?
Here our goal is to predict the price, which is a quantitative value, that is why we call that a regression problem (in opposition to classification problems for which we predict qualitative value, for example “Is it a dog or a cat?”).

To evaluate the performance I will use a metric called RMSE which stands for Root Mean Squared Error. Do not be afraid by this strange name, it is actually very simple and oftenly used as performance metric.
Basically here is how it works:
- we predict the price: let’s call the result y_pred
- we compare y_pred with the real price y and compute the difference y - y_pred: this is our error. Note that it can be a positive or a negative number depending on our prediction (did we predict above or below the real price?)
- as this error can be positive or negative, when summing all errors to see how much we are wrong we do not want negative errors kind of cancel positive errors. That is why the error is squarred so that the error will always be a positive number.
- those squarred errors are then summed and this number is then divided by the number of elements for which we are making prediction, so it is in the end a mean value for overall error.
- in the end we take the square root
One of the advantages (among others) it that RMSE gives higher weightage and punishes large errors (due to the power of 2). You can then easily understand that the lower this RMSE value, the best our model will be. Our model will then have for objective to minimize this value.
OK so now what is the model to use?
Actually I will not pick one model randomly but instead I will try a few:
- a very “naive” one that will return as predicted value the mean price of the neighbourhood the listing belongs to
- another very simple statistic model: a linear regression (it will be our reference model to compare to)
- a model based on decision trees
- a more complex model (but yet still based on trees) named XGBoost.
Why?
- Naive model
- Motivation for the naive model is to compare more complex models with something very simple that does not even require machine learning and see how much we do better (or not…).
I could have applied the mean price of the whole dataset, that would have been even more naive but let’s challenge it a little bit as we have seen that price varies from one neighbourhood to another.
As a customer I would expect a listing to cost something around the mean in the neighbourhood. Of course there are much more features that have impacts on the price (I guess that number of beds, accomodates and so on are part of that but let’s keep things simple, it’s a naive predictor after all…).
- Linear Regression
- It is a very basic model but which sometimes give good results and could be an outsider due to the computation time which is not very high.
- Decision tree
- The cool thing with trees is that it is possible to plot them, so explain them. Interpretability of the results is one of the major obstacles and challenges of Machine Learning10.
Well, with decision trees, we can do that because the algorithm is just a sequence of binary decision (if variable is higher than this value, go to right, else go to left, and so on). By plotting the full tree in the end we are able to understand why we arrived to such a prediction.
More than that we are also able to have a look at features (i.e parameters) importance and see what are the ones that contribute the most to the prediction value.
- Extreme Gradient Boosting (XGBoost)
- XGBoost is also based on trees and has proven to be a very powerful machine learning technique which is often used on Kaggle competitions to solve problems.
If XGBoost is also based on tree, why trying it?
Because I would like to try an ensemble method: the key principle is that it builds a lot of simple decision trees instead of building a complex model that tries to understand very well the data or even finds relationships between columns — that would obviously lead us to something hard to understand.
Each tree, taken independently is very simple but the strength here is that combining predictions coming from all those basic estimators will provide in the end a stronger model, so a better prediction.
There are several ensemble technics11. With XGBoost training is sequential and trees are added over iterations in order to reduce the errors made by the combination of all the previous ones.
As an example, here is what we can produce with Decision Tree:
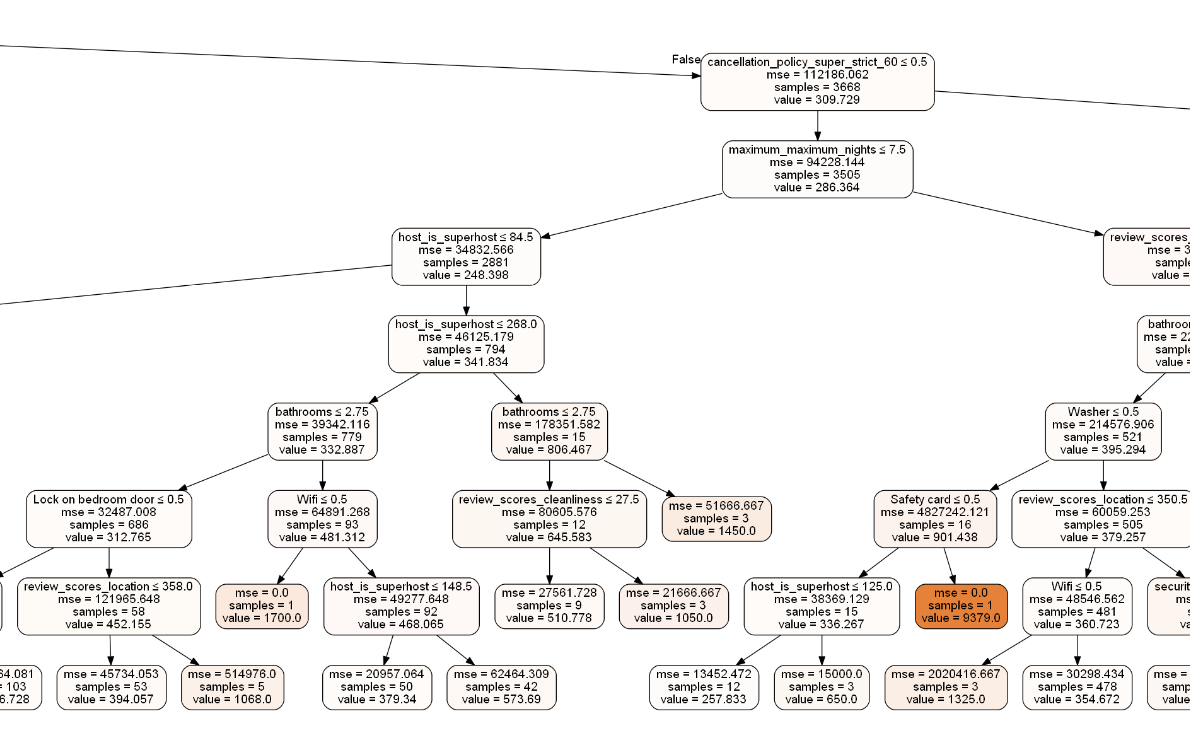
Note: we can specify the depth of the tree (i.e number of levels) and in the end, in leaves, you can see that value corresponds to the predicted price.
The results (at least!)
Algorithms predictions
After a mandatory data preparation phase and some little transformations to handle missing values, here are the first results I got:
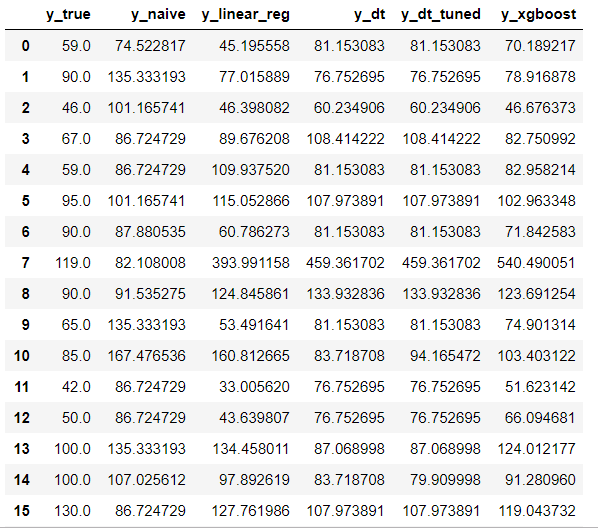
Note: 1st column is the real price whereas following ones are the predicted price for each of the tried algorithm.
On the 15 displayed rows, most of the time the XGBoost prediction is not very far from the truth.
BUT sometimes it is totally wrong. For example the 540€ prediction while the truth was 119€ (line 7).
It is interesting to note that DecisionTree (y_dt) and LinearRegression(y_linear_reg) are wrong as well with also big difference (though XGBoost remains the worst).
To go further and perhaps having a better general intuition about how good or how bad are those results, I have decided to classify predictions into different groups based on the error percentage between prediction and ground truth. The motivation for that is that it is not the same thing when you are wrong of 40€ when the actual price is 100€ or when it is 1000€.
Here are then the 6 categories:
- 1-very accurate (prediction is 2% less or more than the truth)
- 2-pretty good: 2 to 5%
- 3-good: 5 to 10%
- 4-acceptable: 10 to 20%
- 5-bad: 20 to 40%
- 6-awful: more than 40%
Algorithms predictions classification
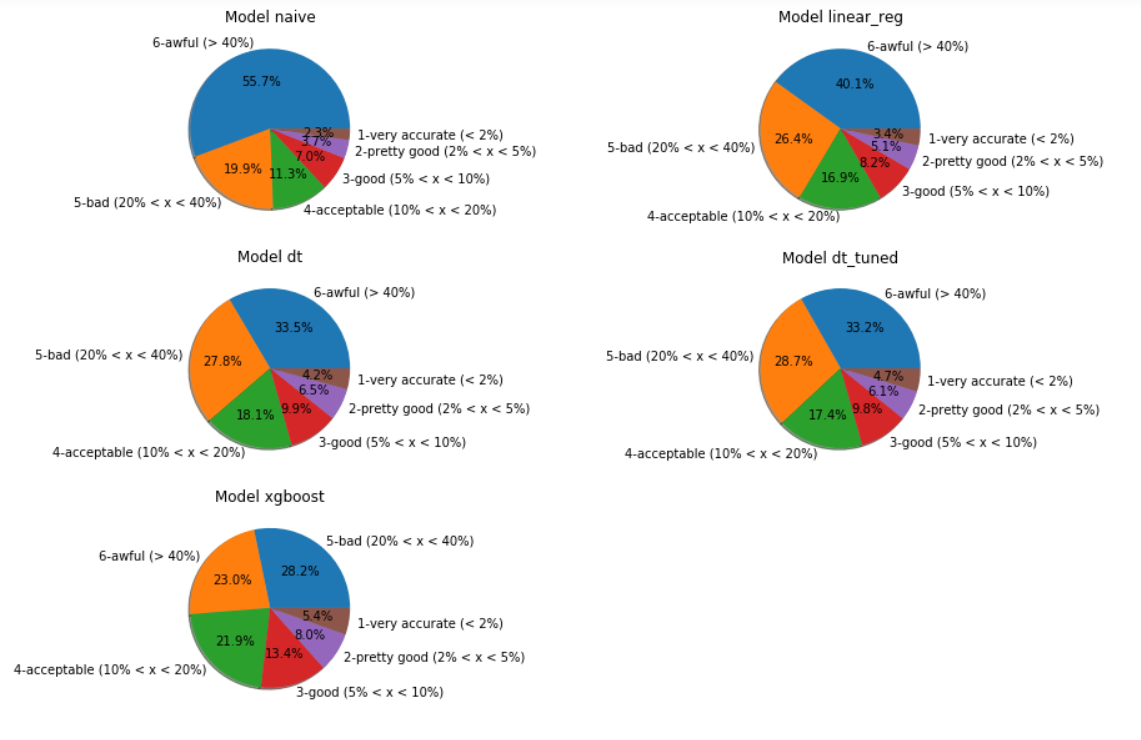
XGBoost is our best candidate for further tuning. We can see how it reduced the number of elements in class 6 (worst ones) in comparison to other models.
Classes 1 to 4 counts for 48.75% with XGBoost. It means than once in two our best model is at least wrong about 20% the real value of the price.
I said earlier that with trees it is possible to analyze what were the features (i.e columns in the data table) that had the most importance in the tree building.
Here is an example for XGBoost:
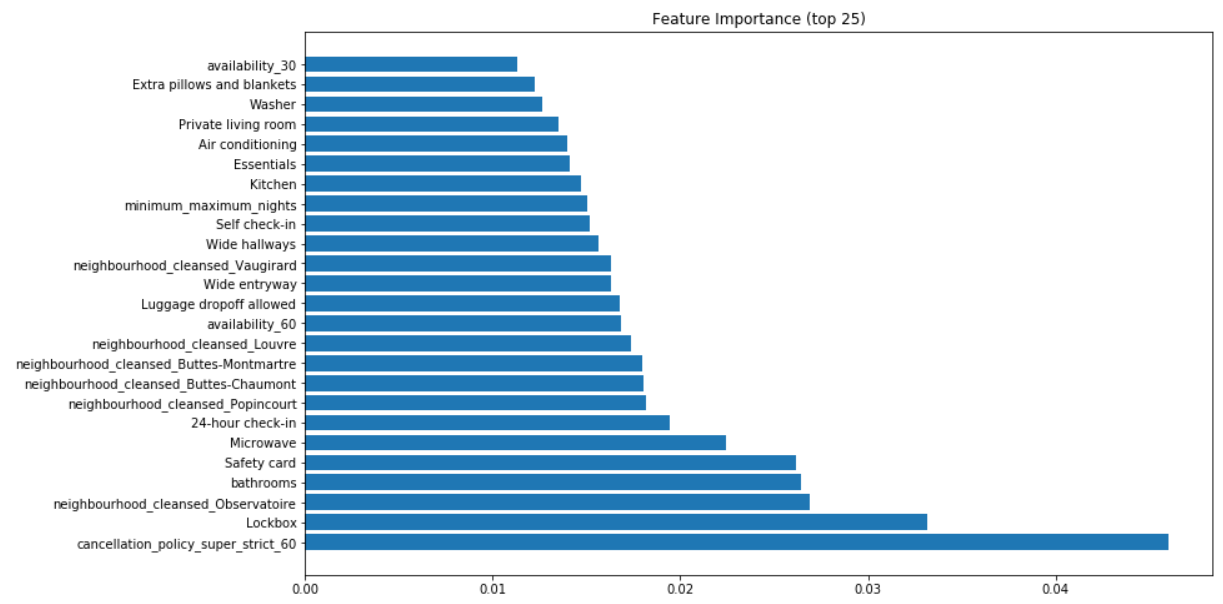
Note: you can read 0.04 value by saying that 4% of the price is explained by this or that feature. For example the number of bathrooms (4th position) explains 2.5% of a listing price.
Tuning phase
Next step is to select the best candidate and tune it.

Machine Learning algorithms may have 1 to a lot of parameters (so called hyper-parameters) that the DataScientist can play with.
The tuning phase consists in trying to change one, few or all of them and see if results are improved.
As you can easily imagine, depending on the number of hyper-parameters this task can be very time consuming.
Moreover we will never have the absolute warranty that in the end the hyper-parameters combination found would be THE best one, it will just be the best among all our tries.
There are technical ways to optimize the search but it is far beyond the scope of this post.
Fortunately (or not), XGBoost has a lot of hyper-parameters (that is one of its drawbacks) so this tuning phase can very soon turn itself into a never ending one…
Anyway, in order to improve our good but not totally satisfying results, tuning has been made with XGBoost and several techniques (that will not be detailed here but which you can retrieve in the code repository12).
Tuning results
Several tuning techniques (so models) were tried. Here are the predictions classification results:
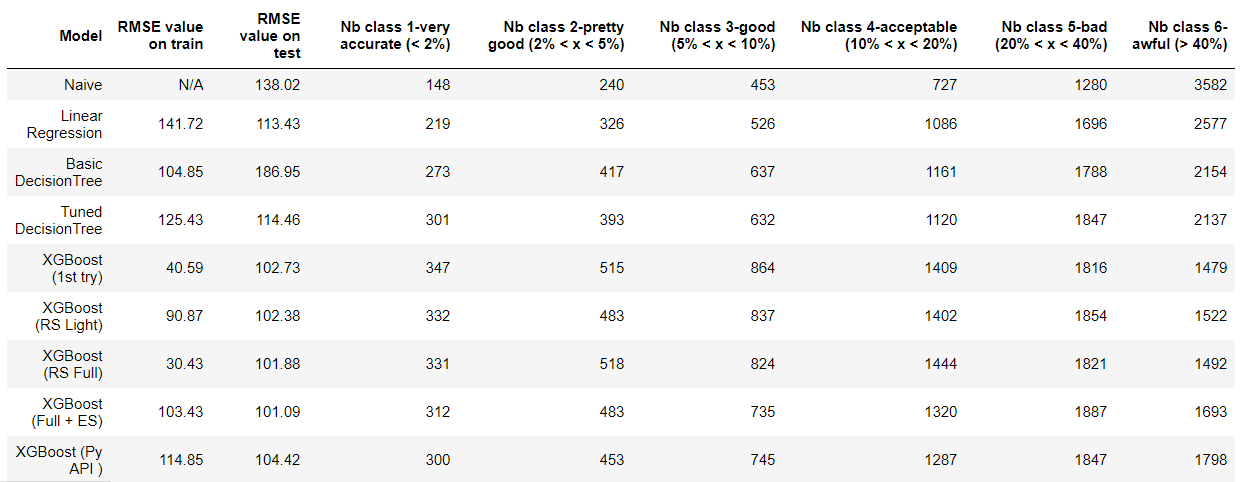
In spite of all the efforts made for parameters tuning, I was unable to improve significantly the results I got with the first try. Even if I found a combination that slightly improved the RMSE value, when analyzing in more details the first XGBoost remains the best choice as it is with it that most of the prices are near the truth.
To improve results, here are some things one could do:
- Try another model, for example Catboost from the russian company Yandex (as we have a lot of categorical features) and they say that there is less parameter tuning.
- Try to reduce the number of data input features with dimensionnality reduction techniques (for example PCA).
- Perform feature engineering by building new features.
- Create an ensemble of models, stack them then average the results.
WRAP-UP
Based on all our observations within provided data we have seen that:
- It will cost you more or less 116€/night in average but this varies a lot depending on the neighbourhood where you plan to stay.
- The most expensive neighbourhoods are the one in the center of the city, you will pay less and less gradually as you go further but be careful because in those neighbourhoods, the availability rate is not very high. You will find apartments in which people live most of the time and rent when they are away from their home.
- If money is an important criteria for your visit then you can divide by 2 the mean price by choosing a shared room and there are almost everywhere (but a few) in the city so that you are not stucked in a specific place.
- There are a lot of places to rent in August and prices are lower but this information is merely due to:
- the fact that the data are from July, homeowners may have offered discount prices to engage website visitors
- a lot of people living in Paris are in holidays somewhere else => more places, lower prices.
- The other 2 periods with more availability are in early October or early January but for the second period, it will cost you much more (+6% in average during Christmas holidays and it can increase until +19% for New Year’s Day depending on the neighbourhood).
Price prediction gave first encouraging results which still need to be improved through further investigations.
Even if it is quite frustrating not having improved the results, let’s recall that the first goal of this project was to show our ability to follow the
Datascience process and this is what has been done through the different steps: Data Understanding, Business Understanding, Data preparation, Modeling, tuning and Evaluation.
And let’s say that to see the glass half full, we were able to build a model with 80% price prediction accuracy half the time. Naive model was 80% precision 25% of the time and linear regression 33% of the time.

The world of data is a very fascinating one and you could never end to try to do something with data, interpret it.
Here you have read just an example of what is possible but we could imagine a lot of other things to try:
- we have all data since 2015, one could grab all data per year, keep listings that exists over all years and analyze trends (seasonal, recurrents). Why not timeseries forecasting?
- we have all the reviews, one could try to do NLP (Natural Language Processing) and classify reviews as positive/negative ones, try to detect recurrent topics per neighbourhood…
So, are you ready to give a try by yourself? Collect the data, it’s here!
Author: nidragedd
If you would like to check out the whole project you can see it from my Github repository.
You can also directly give a look at the Jupyter notebooks if you prefer.
-
Paris is the most visited city according to Telegraph.co.uk website ↩
-
Paris is the 2nd most visited city according to a ranking compiled by Mastercard Inc. ↩
-
AlphaZero mastering games on DeepMind blog ↩
-
A general reinforcement learning algorithm that masters chess, shogi, and Go through self-play on Science ↩
-
Airflow tool was born at Airbnb and is now under Apache Software Foundation ↩
-
Airbnb technical blog about AI ↩
-
Paris, what price for your neighbourhood? (in french on seloger.com) ↩
-
“Please, explain the black-box” by Olga Mierzwa-Sulima ↩
-
Ensemble methods: bagging, boosting and stacking, understanding the key concepts of ensemble learning ↩
Feel free to leave a (nice) comment if you want
Required fields are marked *